nup107
| 0 | 1 | 2 | 3 | 4 | 5 | 6 | 7 | 8 | |
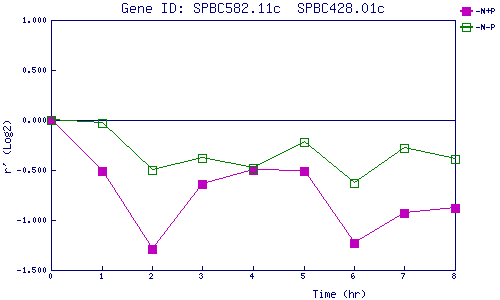
| -N+P | 0.000 | -0.506 | -1.291 | -0.645 | -0.500 | -0.510 | -1.231 | -0.930 | -0.883 |
| -N-P | 0.000 | -0.031 | -0.496 | -0.381 | -0.484 | -0.221 | -0.630 | -0.284 | -0.388 |
|
-N+P: Nitrogen starved in the presence of P-factor -N-P: Nitrogen starved in the absence of P-factor |