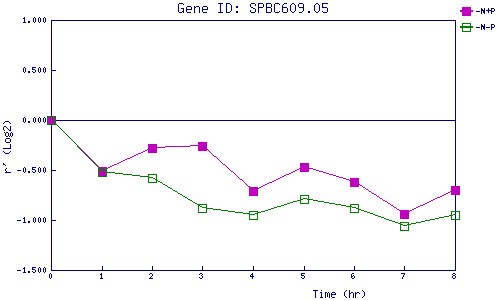
| 0 | 1 | 2 | 3 | 4 | 5 | 6 | 7 | 8 | |
| -N+P | 0.000 | -0.513 | -0.283 | -0.255 | -0.712 | -0.474 | -0.622 | -0.940 | -0.696 |
| -N-P | 0.000 | -0.521 | -0.575 | -0.878 | -0.948 | -0.792 | -0.883 | -1.057 | -0.950 |
|
-N+P: Nitrogen starved in the presence of P-factor -N-P: Nitrogen starved in the absence of P-factor |