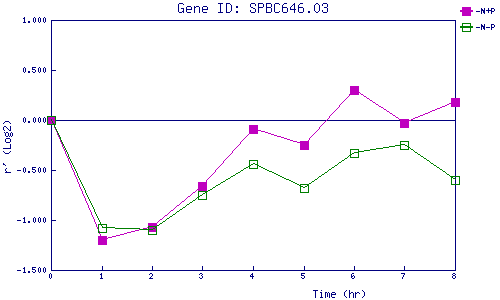
| 0 | 1 | 2 | 3 | 4 | 5 | 6 | 7 | 8 | |
| -N+P | 0.000 | -1.204 | -1.072 | -0.663 | -0.086 | -0.246 | 0.305 | -0.032 | 0.184 |
| -N-P | 0.000 | -1.077 | -1.105 | -0.752 | -0.438 | -0.683 | -0.331 | -0.246 | -0.599 |
|
-N+P: Nitrogen starved in the presence of P-factor -N-P: Nitrogen starved in the absence of P-factor |