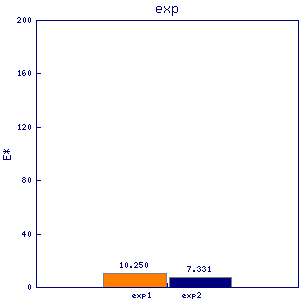
pla1
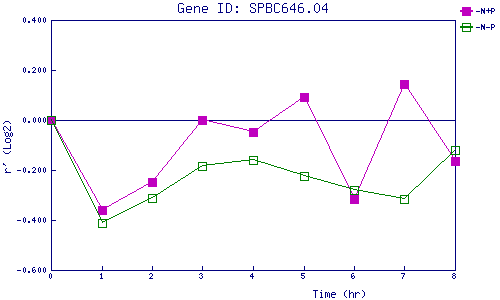
| 0 | 1 | 2 | 3 | 4 | 5 | 6 | 7 | 8 | |
| -N+P | 0.000 | -0.360 | -0.249 | -0.002 | -0.047 | 0.091 | -0.317 | 0.143 | -0.164 |
| -N-P | 0.000 | -0.413 | -0.311 | -0.182 | -0.159 | -0.226 | -0.278 | -0.315 | -0.119 |
|
-N+P: Nitrogen starved in the presence of P-factor -N-P: Nitrogen starved in the absence of P-factor |