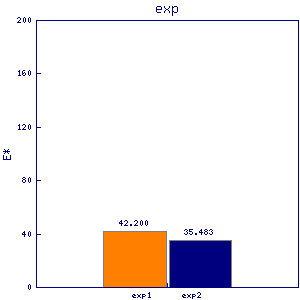
erg9
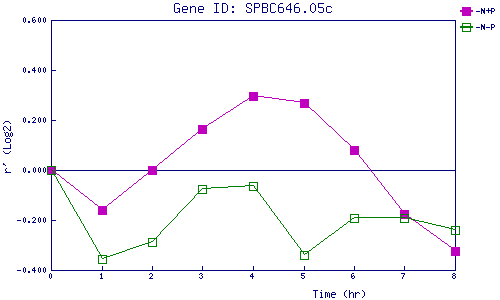
| 0 | 1 | 2 | 3 | 4 | 5 | 6 | 7 | 8 | |
| -N+P | 0.000 | -0.162 | 0.002 | 0.163 | 0.298 | 0.269 | 0.079 | -0.178 | -0.325 |
| -N-P | 0.000 | -0.355 | -0.288 | -0.077 | -0.066 | -0.341 | -0.193 | -0.194 | -0.239 |
|
-N+P: Nitrogen starved in the presence of P-factor -N-P: Nitrogen starved in the absence of P-factor |