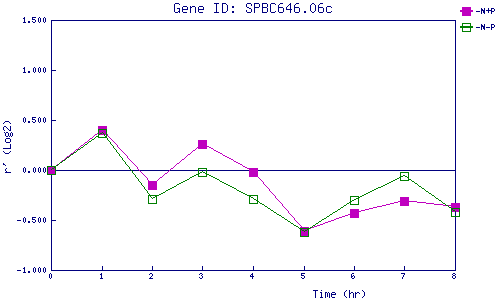
| 0 | 1 | 2 | 3 | 4 | 5 | 6 | 7 | 8 | |
| -N+P | 0.000 | 0.401 | -0.146 | 0.258 | -0.021 | -0.612 | -0.426 | -0.311 | -0.371 |
| -N-P | 0.000 | 0.372 | -0.286 | -0.015 | -0.291 | -0.618 | -0.300 | -0.062 | -0.420 |
|
-N+P: Nitrogen starved in the presence of P-factor -N-P: Nitrogen starved in the absence of P-factor |