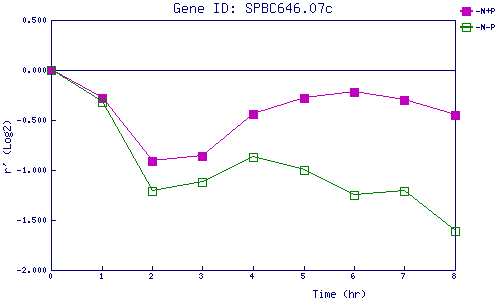
| 0 | 1 | 2 | 3 | 4 | 5 | 6 | 7 | 8 | |
| -N+P | 0.000 | -0.276 | -0.909 | -0.859 | -0.437 | -0.275 | -0.215 | -0.297 | -0.454 |
| -N-P | 0.000 | -0.316 | -1.208 | -1.120 | -0.871 | -0.998 | -1.247 | -1.210 | -1.613 |
|
-N+P: Nitrogen starved in the presence of P-factor -N-P: Nitrogen starved in the absence of P-factor |