int6 yin6
| 0 | 1 | 2 | 3 | 4 | 5 | 6 | 7 | 8 | |
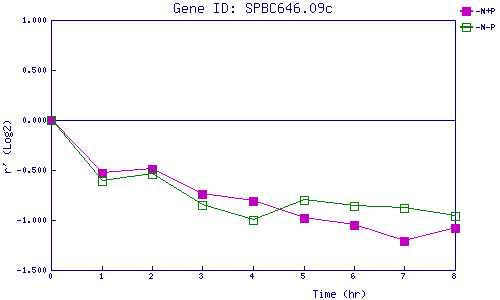
| -N+P | 0.000 | -0.530 | -0.486 | -0.736 | -0.812 | -0.978 | -1.054 | -1.210 | -1.084 |
| -N-P | 0.000 | -0.611 | -0.540 | -0.852 | -1.004 | -0.800 | -0.857 | -0.877 | -0.962 |
|
-N+P: Nitrogen starved in the presence of P-factor -N-P: Nitrogen starved in the absence of P-factor |