| 0 | 1 | 2 | 3 | 4 | 5 | 6 | 7 | 8 | |
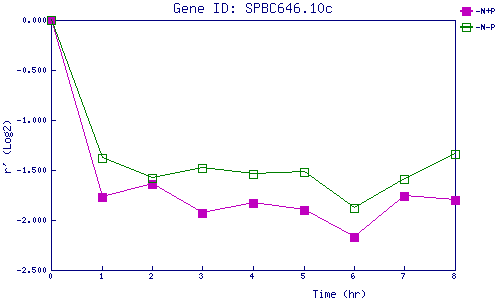
| -N+P | 0.000 | -1.768 | -1.642 | -1.932 | -1.832 | -1.900 | -2.173 | -1.762 | -1.804 |
| -N-P | 0.000 | -1.379 | -1.576 | -1.483 | -1.544 | -1.524 | -1.879 | -1.590 | -1.343 |
|
-N+P: Nitrogen starved in the presence of P-factor -N-P: Nitrogen starved in the absence of P-factor |