cct6
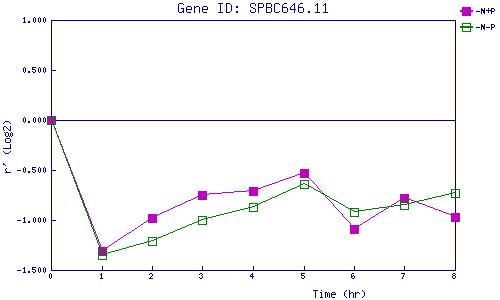
| 0 | 1 | 2 | 3 | 4 | 5 | 6 | 7 | 8 | |
| -N+P | 0.000 | -1.307 | -0.977 | -0.753 | -0.708 | -0.533 | -1.086 | -0.776 | -0.973 |
| -N-P | 0.000 | -1.351 | -1.208 | -1.003 | -0.870 | -0.645 | -0.923 | -0.853 | -0.732 |
|
-N+P: Nitrogen starved in the presence of P-factor -N-P: Nitrogen starved in the absence of P-factor |