gap1 src1 sar1
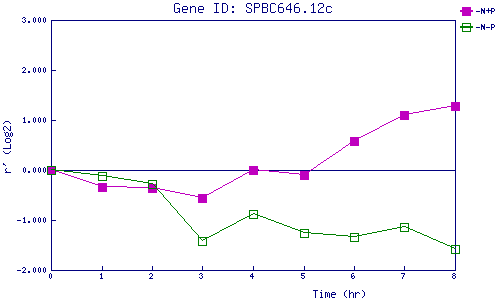
| 0 | 1 | 2 | 3 | 4 | 5 | 6 | 7 | 8 | |
| -N+P | 0.000 | -0.331 | -0.363 | -0.554 | -0.002 | -0.092 | 0.572 | 1.096 | 1.285 |
| -N-P | 0.000 | -0.114 | -0.274 | -1.411 | -0.882 | -1.258 | -1.334 | -1.138 | -1.586 |
|
-N+P: Nitrogen starved in the presence of P-factor -N-P: Nitrogen starved in the absence of P-factor |