sds23 moc1 psp1
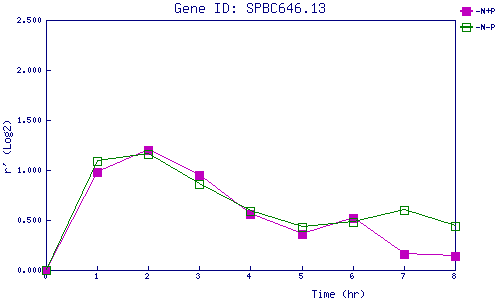
| 0 | 1 | 2 | 3 | 4 | 5 | 6 | 7 | 8 | |
| -N+P | 0.000 | 0.984 | 1.205 | 0.954 | 0.558 | 0.360 | 0.523 | 0.165 | 0.138 |
| -N-P | 0.000 | 1.093 | 1.158 | 0.857 | 0.589 | 0.431 | 0.475 | 0.605 | 0.437 |
|
-N+P: Nitrogen starved in the presence of P-factor -N-P: Nitrogen starved in the absence of P-factor |