orc5
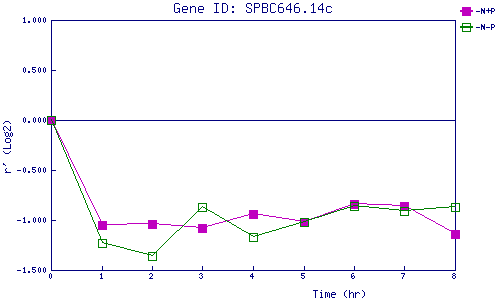
| 0 | 1 | 2 | 3 | 4 | 5 | 6 | 7 | 8 | |
| -N+P | 0.000 | -1.052 | -1.044 | -1.079 | -0.943 | -1.016 | -0.845 | -0.858 | -1.141 |
| -N-P | 0.000 | -1.232 | -1.357 | -0.874 | -1.168 | -1.022 | -0.862 | -0.913 | -0.871 |
|
-N+P: Nitrogen starved in the presence of P-factor -N-P: Nitrogen starved in the absence of P-factor |