klp6
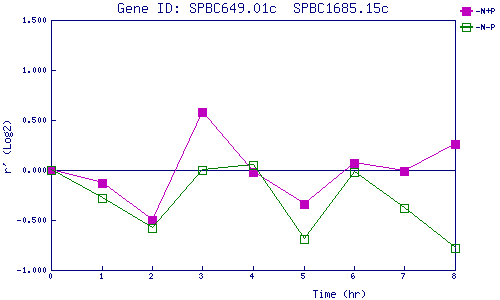
| 0 | 1 | 2 | 3 | 4 | 5 | 6 | 7 | 8 | |
| -N+P | 0.000 | -0.132 | -0.499 | 0.581 | -0.016 | -0.341 | 0.073 | -0.011 | 0.255 |
| -N-P | 0.000 | -0.285 | -0.578 | 0.005 | 0.053 | -0.694 | -0.025 | -0.384 | -0.777 |
|
-N+P: Nitrogen starved in the presence of P-factor -N-P: Nitrogen starved in the absence of P-factor |