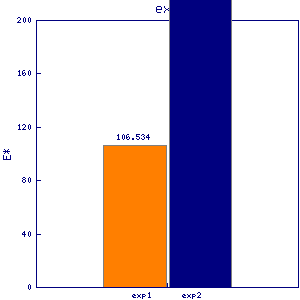
rps19 rps1902 rps19-2
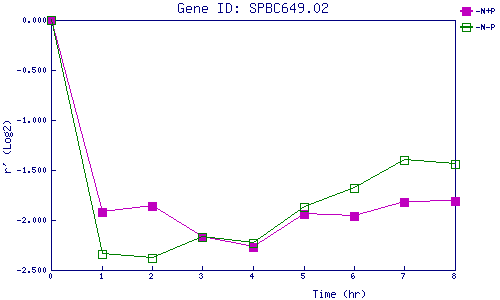
| 0 | 1 | 2 | 3 | 4 | 5 | 6 | 7 | 8 | |
| -N+P | 0.000 | -1.925 | -1.863 | -2.168 | -2.274 | -1.942 | -1.956 | -1.818 | -1.807 |
| -N-P | 0.000 | -2.345 | -2.383 | -2.168 | -2.226 | -1.873 | -1.677 | -1.404 | -1.440 |
|
-N+P: Nitrogen starved in the presence of P-factor -N-P: Nitrogen starved in the absence of P-factor |