cut12 stf1
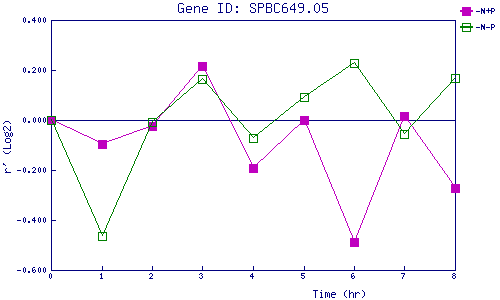
| 0 | 1 | 2 | 3 | 4 | 5 | 6 | 7 | 8 | |
| -N+P | 0.000 | -0.098 | -0.025 | 0.216 | -0.193 | 0.002 | -0.488 | 0.015 | -0.274 |
| -N-P | 0.000 | -0.465 | -0.009 | 0.164 | -0.074 | 0.092 | 0.229 | -0.055 | 0.170 |
|
-N+P: Nitrogen starved in the presence of P-factor -N-P: Nitrogen starved in the absence of P-factor |