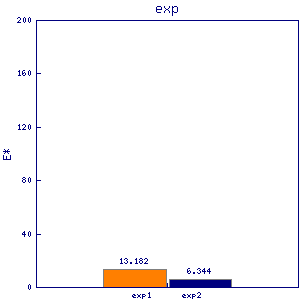
gyp10
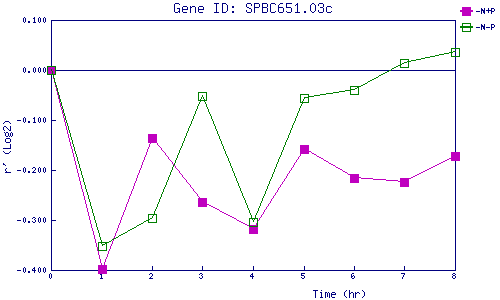
| 0 | 1 | 2 | 3 | 4 | 5 | 6 | 7 | 8 | |
| -N+P | 0.000 | -0.398 | -0.136 | -0.264 | -0.318 | -0.158 | -0.216 | -0.223 | -0.172 |
| -N-P | 0.000 | -0.351 | -0.295 | -0.051 | -0.304 | -0.057 | -0.040 | 0.014 | 0.037 |
|
-N+P: Nitrogen starved in the presence of P-factor -N-P: Nitrogen starved in the absence of P-factor |