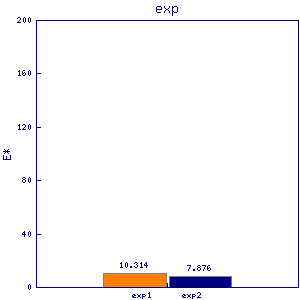
rpc1
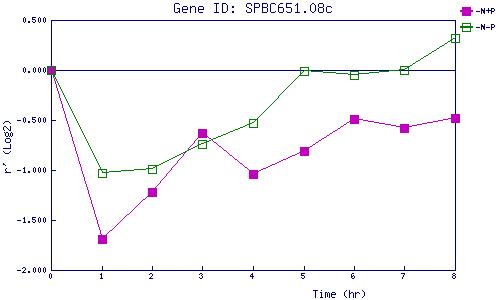
| 0 | 1 | 2 | 3 | 4 | 5 | 6 | 7 | 8 | |
| -N+P | 0.000 | -1.690 | -1.223 | -0.633 | -1.039 | -0.806 | -0.488 | -0.583 | -0.482 |
| -N-P | 0.000 | -1.027 | -0.990 | -0.741 | -0.526 | -0.007 | -0.051 | 0.000 | 0.325 |
|
-N+P: Nitrogen starved in the presence of P-factor -N-P: Nitrogen starved in the absence of P-factor |