| 0 | 1 | 2 | 3 | 4 | 5 | 6 | 7 | 8 | |
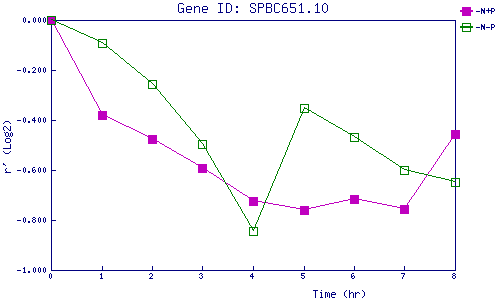
| -N+P | 0.000 | -0.381 | -0.477 | -0.594 | -0.723 | -0.762 | -0.716 | -0.757 | -0.458 |
| -N-P | 0.000 | -0.091 | -0.258 | -0.494 | -0.845 | -0.352 | -0.467 | -0.599 | -0.650 |
|
-N+P: Nitrogen starved in the presence of P-factor -N-P: Nitrogen starved in the absence of P-factor |