apm2
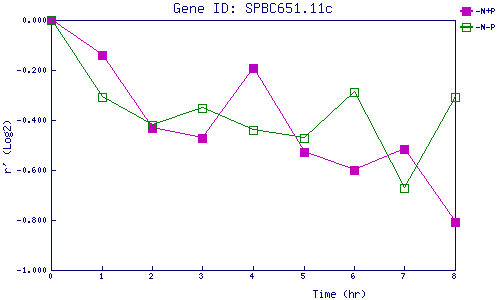
| 0 | 1 | 2 | 3 | 4 | 5 | 6 | 7 | 8 | |
| -N+P | 0.000 | -0.141 | -0.433 | -0.471 | -0.192 | -0.526 | -0.601 | -0.516 | -0.808 |
| -N-P | 0.000 | -0.308 | -0.419 | -0.351 | -0.438 | -0.473 | -0.286 | -0.672 | -0.309 |
|
-N+P: Nitrogen starved in the presence of P-factor -N-P: Nitrogen starved in the absence of P-factor |