tcg1
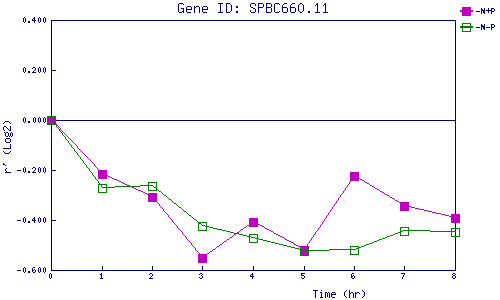
| 0 | 1 | 2 | 3 | 4 | 5 | 6 | 7 | 8 | |
| -N+P | 0.000 | -0.217 | -0.309 | -0.553 | -0.409 | -0.518 | -0.225 | -0.344 | -0.393 |
| -N-P | 0.000 | -0.273 | -0.264 | -0.422 | -0.471 | -0.523 | -0.522 | -0.443 | -0.446 |
|
-N+P: Nitrogen starved in the presence of P-factor -N-P: Nitrogen starved in the absence of P-factor |