ssb1 rpa1 rad11
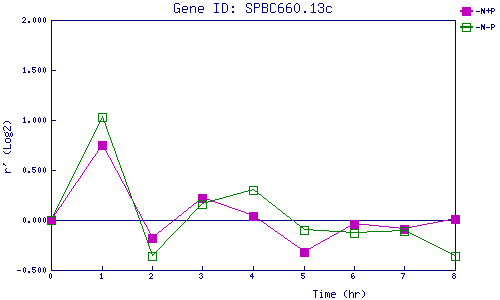
| 0 | 1 | 2 | 3 | 4 | 5 | 6 | 7 | 8 | |
| -N+P | 0.000 | 0.754 | -0.182 | 0.220 | 0.039 | -0.317 | -0.039 | -0.087 | 0.013 |
| -N-P | 0.000 | 1.030 | -0.359 | 0.155 | 0.300 | -0.102 | -0.129 | -0.113 | -0.362 |
|
-N+P: Nitrogen starved in the presence of P-factor -N-P: Nitrogen starved in the absence of P-factor |