mik1
| 0 | 1 | 2 | 3 | 4 | 5 | 6 | 7 | 8 | |
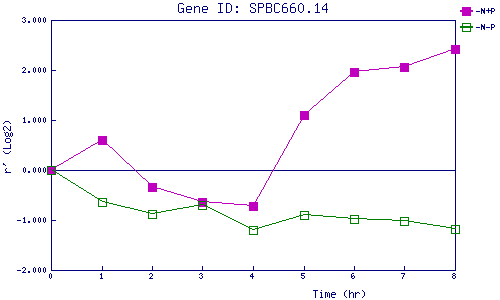
| -N+P | 0.000 | 0.598 | -0.346 | -0.634 | -0.722 | 1.100 | 1.955 | 2.055 | 2.414 |
| -N-P | 0.000 | -0.646 | -0.887 | -0.699 | -1.201 | -0.895 | -0.985 | -1.024 | -1.176 |
|
-N+P: Nitrogen starved in the presence of P-factor -N-P: Nitrogen starved in the absence of P-factor |
