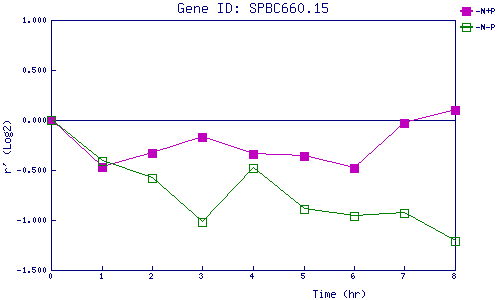
| 0 | 1 | 2 | 3 | 4 | 5 | 6 | 7 | 8 | |
| -N+P | 0.000 | -0.472 | -0.331 | -0.173 | -0.341 | -0.357 | -0.477 | -0.027 | 0.097 |
| -N-P | 0.000 | -0.411 | -0.576 | -1.017 | -0.478 | -0.888 | -0.961 | -0.931 | -1.210 |
|
-N+P: Nitrogen starved in the presence of P-factor -N-P: Nitrogen starved in the absence of P-factor |