| 0 | 1 | 2 | 3 | 4 | 5 | 6 | 7 | 8 | |
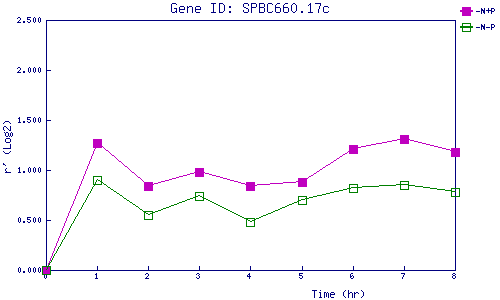
| -N+P | 0.000 | 1.266 | 0.840 | 0.985 | 0.843 | 0.879 | 1.208 | 1.311 | 1.181 |
| -N-P | 0.000 | 0.902 | 0.551 | 0.740 | 0.478 | 0.696 | 0.818 | 0.846 | 0.778 |
|
-N+P: Nitrogen starved in the presence of P-factor -N-P: Nitrogen starved in the absence of P-factor |
| Gene | ||||||||||||||||||||||||||||||
| Gene expression upon nitrogen starvation | ||||||||||||||||||||||||||||||
|
||||||||||||||||||||||||||||||
|
|
||||||||||||||||||||||||||||||
| Values plotted in the graph | ||||||||||||||||||||||||||||||
|
|
||||||||||||||||||||||||||||||
|
||||||||||||||||||||||||||||||
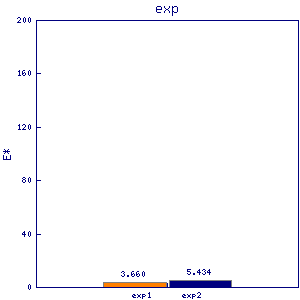
| Number of mRNA in a vegetative growing cell (estimated roughly) | ||||||||||||||||||||||||||||||
|
|
||||||||||||||||||||||||||||||
|
|
||||||||||||||||||||||||||||||