aps2
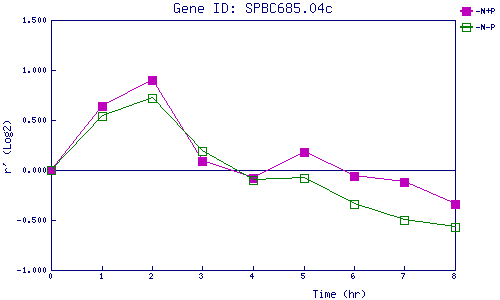
| 0 | 1 | 2 | 3 | 4 | 5 | 6 | 7 | 8 | |
| -N+P | 0.000 | 0.639 | 0.902 | 0.086 | -0.085 | 0.178 | -0.056 | -0.122 | -0.341 |
| -N-P | 0.000 | 0.538 | 0.725 | 0.191 | -0.105 | -0.083 | -0.336 | -0.499 | -0.569 |
|
-N+P: Nitrogen starved in the presence of P-factor -N-P: Nitrogen starved in the absence of P-factor |