rps001 rps0-1 rpsa-1
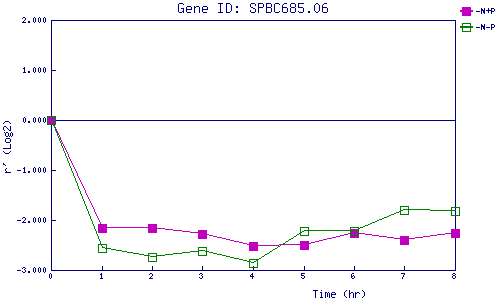
| 0 | 1 | 2 | 3 | 4 | 5 | 6 | 7 | 8 | |
| -N+P | 0.000 | -2.153 | -2.163 | -2.290 | -2.526 | -2.491 | -2.261 | -2.402 | -2.256 |
| -N-P | 0.000 | -2.571 | -2.735 | -2.624 | -2.851 | -2.225 | -2.222 | -1.797 | -1.829 |
|
-N+P: Nitrogen starved in the presence of P-factor -N-P: Nitrogen starved in the absence of P-factor |