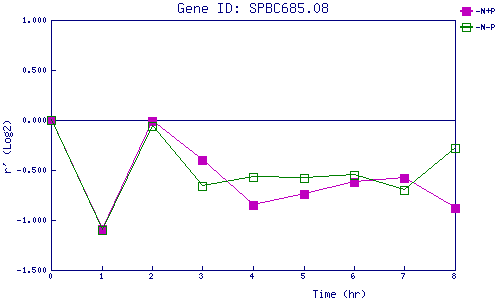
| 0 | 1 | 2 | 3 | 4 | 5 | 6 | 7 | 8 | |
| -N+P | 0.000 | -1.088 | -0.011 | -0.398 | -0.850 | -0.738 | -0.621 | -0.577 | -0.885 |
| -N-P | 0.000 | -1.105 | -0.059 | -0.660 | -0.569 | -0.584 | -0.553 | -0.697 | -0.284 |
|
-N+P: Nitrogen starved in the presence of P-factor -N-P: Nitrogen starved in the absence of P-factor |