orc2 orp2
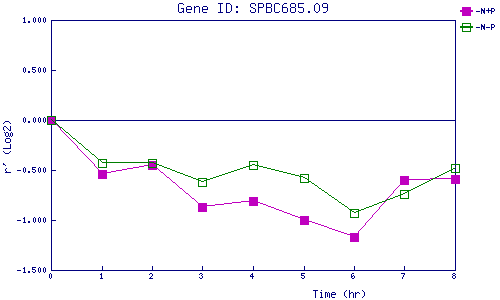
| 0 | 1 | 2 | 3 | 4 | 5 | 6 | 7 | 8 | |
| -N+P | 0.000 | -0.538 | -0.451 | -0.867 | -0.809 | -0.995 | -1.173 | -0.598 | -0.591 |
| -N-P | 0.000 | -0.430 | -0.427 | -0.615 | -0.453 | -0.580 | -0.926 | -0.745 | -0.482 |
|
-N+P: Nitrogen starved in the presence of P-factor -N-P: Nitrogen starved in the absence of P-factor |