apl3 pi033
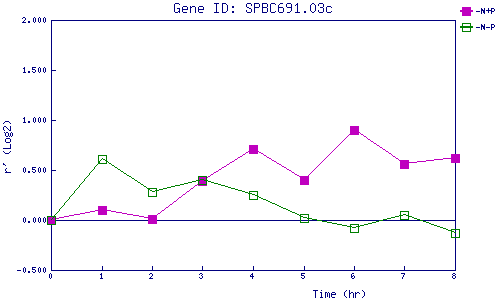
| 0 | 1 | 2 | 3 | 4 | 5 | 6 | 7 | 8 | |
| -N+P | 0.000 | 0.095 | 0.009 | 0.387 | 0.712 | 0.401 | 0.895 | 0.558 | 0.615 |
| -N-P | 0.000 | 0.613 | 0.278 | 0.405 | 0.252 | 0.015 | -0.075 | 0.051 | -0.130 |
|
-N+P: Nitrogen starved in the presence of P-factor -N-P: Nitrogen starved in the absence of P-factor |