pi031
| 0 | 1 | 2 | 3 | 4 | 5 | 6 | 7 | 8 | |
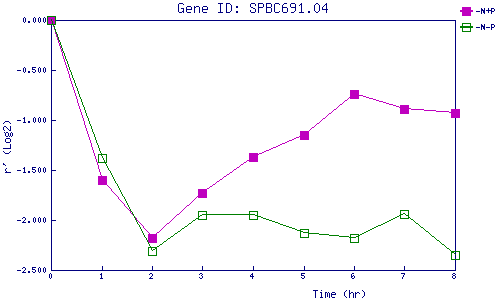
| -N+P | 0.000 | -1.596 | -2.184 | -1.729 | -1.366 | -1.146 | -0.737 | -0.894 | -0.927 |
| -N-P | 0.000 | -1.375 | -2.307 | -1.949 | -1.949 | -2.134 | -2.183 | -1.942 | -2.348 |
|
-N+P: Nitrogen starved in the presence of P-factor -N-P: Nitrogen starved in the absence of P-factor |
