mde4
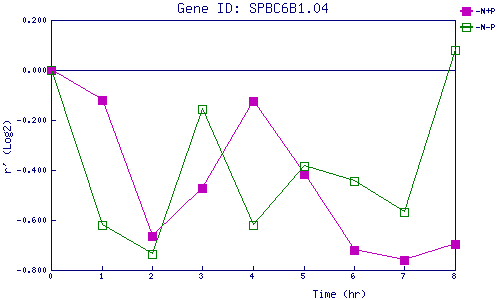
| 0 | 1 | 2 | 3 | 4 | 5 | 6 | 7 | 8 | |
| -N+P | 0.000 | -0.119 | -0.662 | -0.473 | -0.123 | -0.417 | -0.721 | -0.761 | -0.697 |
| -N-P | 0.000 | -0.621 | -0.734 | -0.155 | -0.619 | -0.385 | -0.444 | -0.570 | 0.079 |
|
-N+P: Nitrogen starved in the presence of P-factor -N-P: Nitrogen starved in the absence of P-factor |