reserved_name_ubp14 ucp2
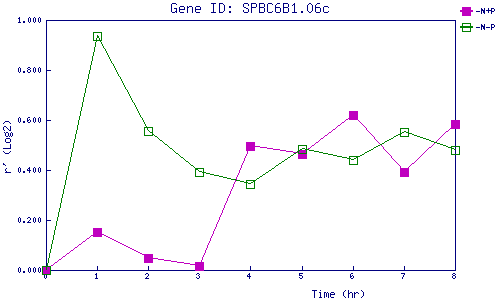
| 0 | 1 | 2 | 3 | 4 | 5 | 6 | 7 | 8 | |
| -N+P | 0.000 | 0.154 | 0.048 | 0.014 | 0.495 | 0.464 | 0.620 | 0.390 | 0.585 |
| -N-P | 0.000 | 0.935 | 0.555 | 0.393 | 0.344 | 0.484 | 0.442 | 0.551 | 0.478 |
|
-N+P: Nitrogen starved in the presence of P-factor -N-P: Nitrogen starved in the absence of P-factor |