prp1 zer1
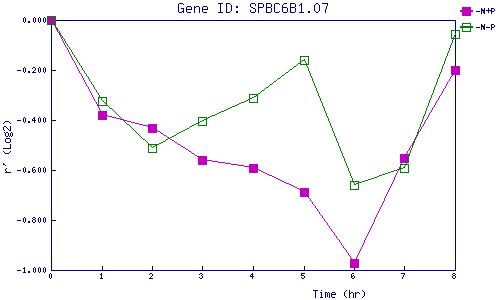
| 0 | 1 | 2 | 3 | 4 | 5 | 6 | 7 | 8 | |
| -N+P | 0.000 | -0.380 | -0.431 | -0.561 | -0.594 | -0.688 | -0.972 | -0.551 | -0.201 |
| -N-P | 0.000 | -0.325 | -0.510 | -0.404 | -0.310 | -0.159 | -0.660 | -0.591 | -0.058 |
|
-N+P: Nitrogen starved in the presence of P-factor -N-P: Nitrogen starved in the absence of P-factor |