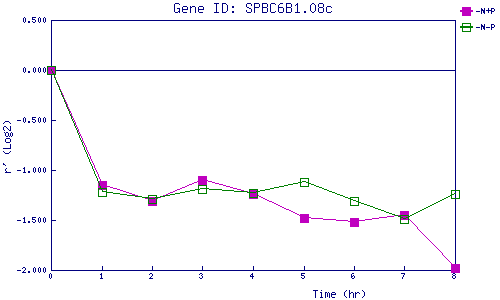
| 0 | 1 | 2 | 3 | 4 | 5 | 6 | 7 | 8 | |
| -N+P | 0.000 | -1.151 | -1.306 | -1.104 | -1.244 | -1.483 | -1.519 | -1.452 | -1.977 |
| -N-P | 0.000 | -1.215 | -1.290 | -1.192 | -1.228 | -1.124 | -1.308 | -1.491 | -1.243 |
|
-N+P: Nitrogen starved in the presence of P-factor -N-P: Nitrogen starved in the absence of P-factor |