| 0 | 1 | 2 | 3 | 4 | 5 | 6 | 7 | 8 | |
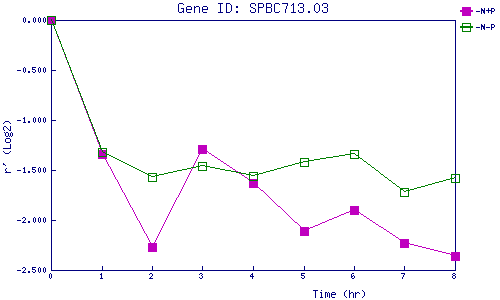
| -N+P | 0.000 | -1.343 | -2.272 | -1.289 | -1.626 | -2.109 | -1.898 | -2.228 | -2.365 |
| -N-P | 0.000 | -1.324 | -1.569 | -1.456 | -1.563 | -1.418 | -1.340 | -1.725 | -1.578 |
|
-N+P: Nitrogen starved in the presence of P-factor -N-P: Nitrogen starved in the absence of P-factor |