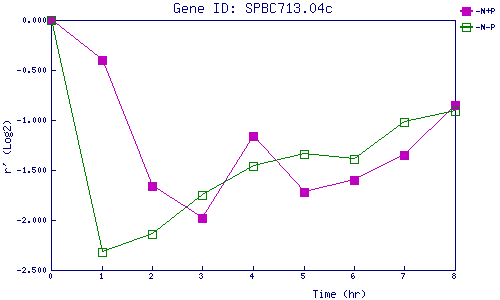
| 0 | 1 | 2 | 3 | 4 | 5 | 6 | 7 | 8 | |
| -N+P | 0.000 | -0.398 | -1.659 | -1.977 | -1.156 | -1.724 | -1.598 | -1.346 | -0.852 |
| -N-P | 0.000 | -2.323 | -2.140 | -1.748 | -1.464 | -1.344 | -1.392 | -1.019 | -0.914 |
|
-N+P: Nitrogen starved in the presence of P-factor -N-P: Nitrogen starved in the absence of P-factor |