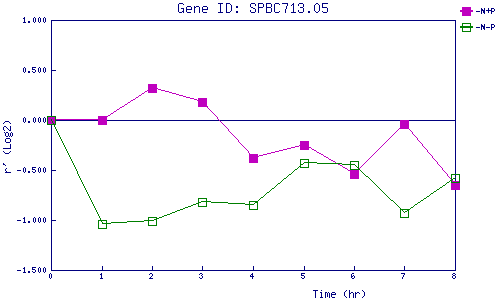
| 0 | 1 | 2 | 3 | 4 | 5 | 6 | 7 | 8 | |
| -N+P | 0.000 | 0.005 | 0.316 | 0.184 | -0.379 | -0.246 | -0.536 | -0.040 | -0.651 |
| -N-P | 0.000 | -1.038 | -1.009 | -0.817 | -0.854 | -0.433 | -0.451 | -0.927 | -0.581 |
|
-N+P: Nitrogen starved in the presence of P-factor -N-P: Nitrogen starved in the absence of P-factor |