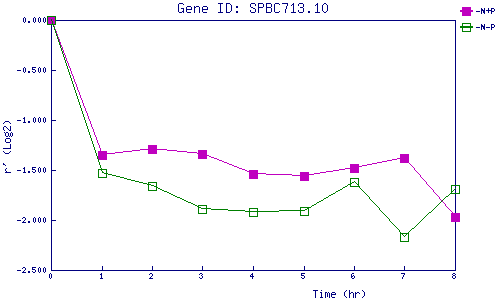
| 0 | 1 | 2 | 3 | 4 | 5 | 6 | 7 | 8 | |
| -N+P | 0.000 | -1.354 | -1.293 | -1.345 | -1.541 | -1.564 | -1.483 | -1.377 | -1.967 |
| -N-P | 0.000 | -1.528 | -1.659 | -1.894 | -1.920 | -1.907 | -1.622 | -2.167 | -1.691 |
|
-N+P: Nitrogen starved in the presence of P-factor -N-P: Nitrogen starved in the absence of P-factor |