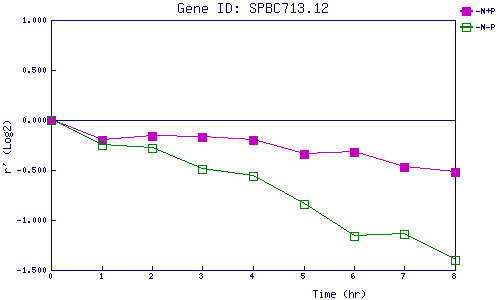
| 0 | 1 | 2 | 3 | 4 | 5 | 6 | 7 | 8 | |
| -N+P | 0.000 | -0.201 | -0.159 | -0.174 | -0.201 | -0.339 | -0.315 | -0.468 | -0.524 |
| -N-P | 0.000 | -0.250 | -0.284 | -0.489 | -0.555 | -0.841 | -1.162 | -1.137 | -1.400 |
|
-N+P: Nitrogen starved in the presence of P-factor -N-P: Nitrogen starved in the absence of P-factor |