mpr1 spy1
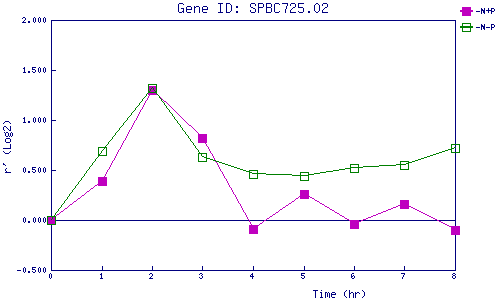
| 0 | 1 | 2 | 3 | 4 | 5 | 6 | 7 | 8 | |
| -N+P | 0.000 | 0.392 | 1.298 | 0.819 | -0.094 | 0.258 | -0.045 | 0.156 | -0.096 |
| -N-P | 0.000 | 0.686 | 1.320 | 0.632 | 0.456 | 0.439 | 0.521 | 0.554 | 0.721 |
|
-N+P: Nitrogen starved in the presence of P-factor -N-P: Nitrogen starved in the absence of P-factor |