pex5
| 0 | 1 | 2 | 3 | 4 | 5 | 6 | 7 | 8 | |
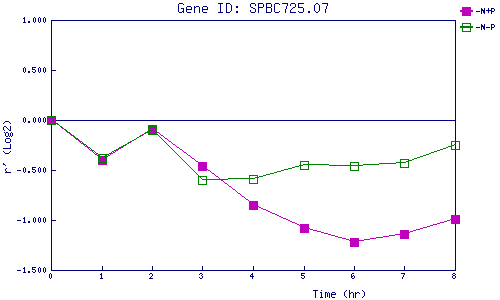
| -N+P | 0.000 | -0.402 | -0.089 | -0.458 | -0.854 | -1.083 | -1.224 | -1.144 | -0.986 |
| -N-P | 0.000 | -0.376 | -0.105 | -0.597 | -0.589 | -0.447 | -0.455 | -0.433 | -0.249 |
|
-N+P: Nitrogen starved in the presence of P-factor -N-P: Nitrogen starved in the absence of P-factor |
