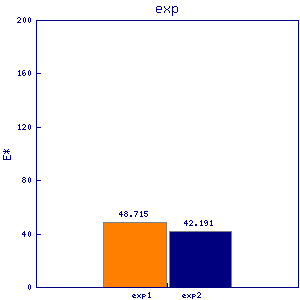
ura5
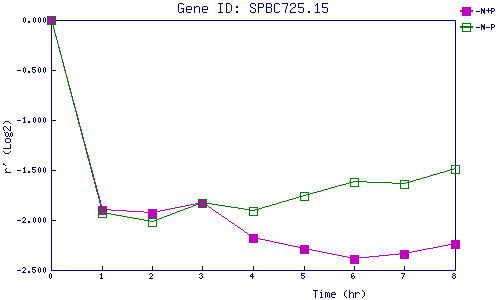
| 0 | 1 | 2 | 3 | 4 | 5 | 6 | 7 | 8 | |
| -N+P | 0.000 | -1.897 | -1.931 | -1.833 | -2.181 | -2.288 | -2.389 | -2.336 | -2.235 |
| -N-P | 0.000 | -1.926 | -2.026 | -1.827 | -1.911 | -1.756 | -1.617 | -1.640 | -1.492 |
|
-N+P: Nitrogen starved in the presence of P-factor -N-P: Nitrogen starved in the absence of P-factor |