res1 sct1
| 0 | 1 | 2 | 3 | 4 | 5 | 6 | 7 | 8 | |
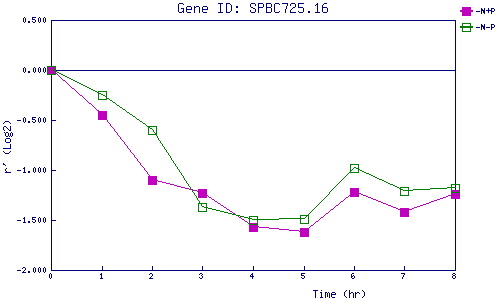
| -N+P | 0.000 | -0.447 | -1.102 | -1.227 | -1.569 | -1.615 | -1.219 | -1.419 | -1.240 |
| -N-P | 0.000 | -0.246 | -0.595 | -1.367 | -1.503 | -1.489 | -0.984 | -1.211 | -1.176 |
|
-N+P: Nitrogen starved in the presence of P-factor -N-P: Nitrogen starved in the absence of P-factor |
