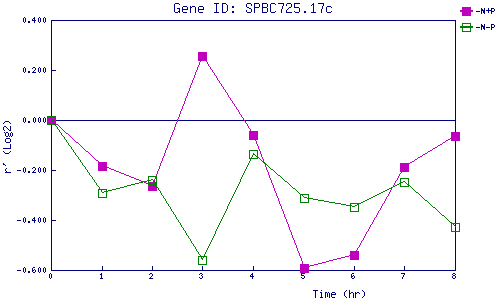
| 0 | 1 | 2 | 3 | 4 | 5 | 6 | 7 | 8 | |
| -N+P | 0.000 | -0.186 | -0.264 | 0.254 | -0.059 | -0.591 | -0.541 | -0.189 | -0.063 |
| -N-P | 0.000 | -0.291 | -0.241 | -0.560 | -0.135 | -0.314 | -0.349 | -0.249 | -0.428 |
|
-N+P: Nitrogen starved in the presence of P-factor -N-P: Nitrogen starved in the absence of P-factor |