rpl29
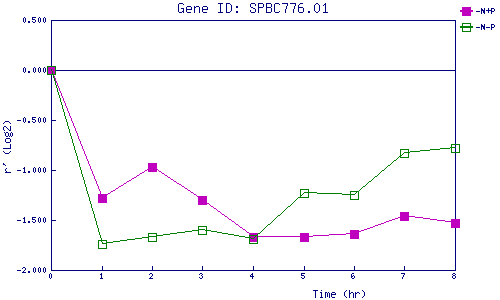
| 0 | 1 | 2 | 3 | 4 | 5 | 6 | 7 | 8 | |
| -N+P | 0.000 | -1.281 | -0.966 | -1.300 | -1.667 | -1.674 | -1.637 | -1.464 | -1.534 |
| -N-P | 0.000 | -1.742 | -1.673 | -1.598 | -1.695 | -1.230 | -1.253 | -0.829 | -0.780 |
|
-N+P: Nitrogen starved in the presence of P-factor -N-P: Nitrogen starved in the absence of P-factor |