dis2 bws1 sds1
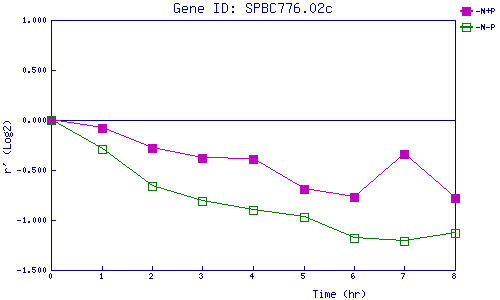
| 0 | 1 | 2 | 3 | 4 | 5 | 6 | 7 | 8 | |
| -N+P | 0.000 | -0.076 | -0.275 | -0.375 | -0.388 | -0.687 | -0.766 | -0.344 | -0.776 |
| -N-P | 0.000 | -0.289 | -0.661 | -0.808 | -0.898 | -0.970 | -1.185 | -1.214 | -1.128 |
|
-N+P: Nitrogen starved in the presence of P-factor -N-P: Nitrogen starved in the absence of P-factor |