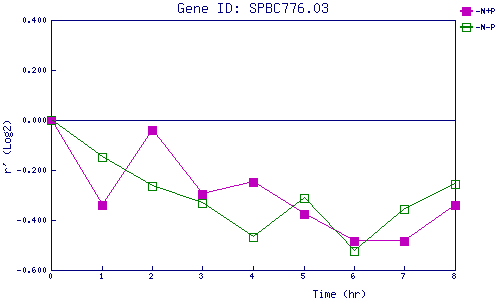
| 0 | 1 | 2 | 3 | 4 | 5 | 6 | 7 | 8 | |
| -N+P | 0.000 | -0.340 | -0.041 | -0.297 | -0.248 | -0.375 | -0.484 | -0.485 | -0.340 |
| -N-P | 0.000 | -0.148 | -0.264 | -0.333 | -0.468 | -0.314 | -0.523 | -0.356 | -0.258 |
|
-N+P: Nitrogen starved in the presence of P-factor -N-P: Nitrogen starved in the absence of P-factor |