sec2302 sec23-b
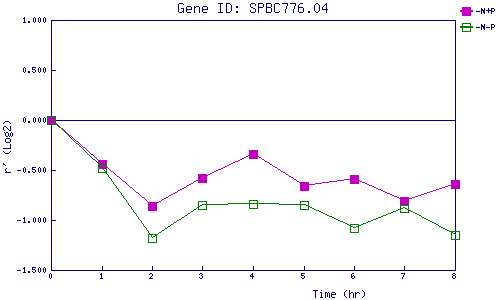
| 0 | 1 | 2 | 3 | 4 | 5 | 6 | 7 | 8 | |
| -N+P | 0.000 | -0.445 | -0.856 | -0.582 | -0.341 | -0.656 | -0.589 | -0.809 | -0.638 |
| -N-P | 0.000 | -0.475 | -1.182 | -0.848 | -0.844 | -0.847 | -1.085 | -0.877 | -1.148 |
|
-N+P: Nitrogen starved in the presence of P-factor -N-P: Nitrogen starved in the absence of P-factor |