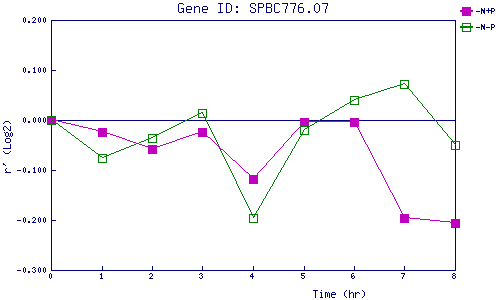
| 0 | 1 | 2 | 3 | 4 | 5 | 6 | 7 | 8 | |
| -N+P | 0.000 | -0.024 | -0.058 | -0.025 | -0.118 | -0.003 | -0.004 | -0.197 | -0.206 |
| -N-P | 0.000 | -0.077 | -0.037 | 0.014 | -0.197 | -0.019 | 0.039 | 0.071 | -0.050 |
|
-N+P: Nitrogen starved in the presence of P-factor -N-P: Nitrogen starved in the absence of P-factor |